Six models, four tests, one shared blind spot
Before we forecast a single race of the 2026 midterms, we wanted to know one thing: can a language model stand in for a group of voters and react to the news the way that group really would? So we asked six of them to try, and scored them against what actually happened.
The test bench ran on 27 and 28 September. It cost $1.52 in total. What it taught us shaped every part of the forecast you will see from 12 October.
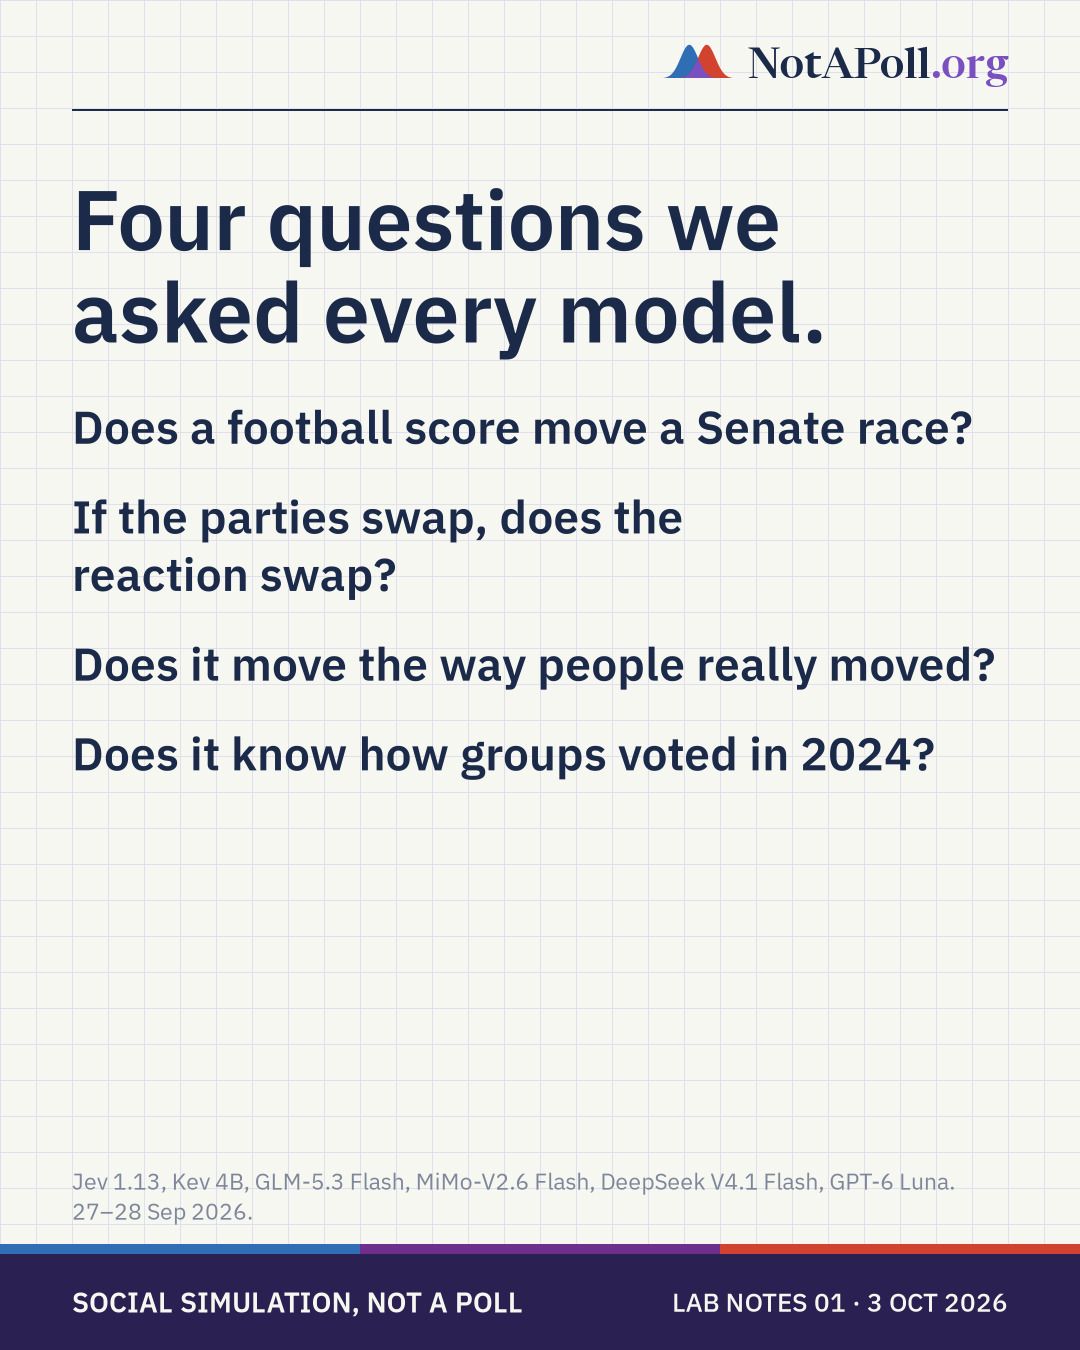
We asked every model the same four questions, in the same words, with the same voter personas.
Does a football score move a Senate race? It shouldn't. We showed each model 20 stories that shouldn't change anyone's vote, from sports results to a new seasonal croissant, and checked whether it stayed still.
If you swap the parties in a story, does the reaction swap with them? We told 16 stories twice, once with a Democrat at the centre and once with a Republican, and looked for any lean left over.
Does it move the way people actually moved? We used 19 real events since 2012 whose effect on opinion was measured at the time, and asked whether each model saw the right direction, and the right size.
Does it know how groups of Americans voted in 2024? We compared its answers with the real vote, group by group.
In detail
The six models were Jev 1.13, Kev 4B before any training of ours, GLM-5.3 Flash, MiMo-V2.6 Flash, DeepSeek V4.1 Flash and GPT-6 Luna, all reached through OpenRouter. Every question was asked twice, with the answer scale in both orders, for reasons we explain in Lab notes 03. The voter personas came from real respondents to the 2024 Cooperative Election Study, chosen to span party, race and education.
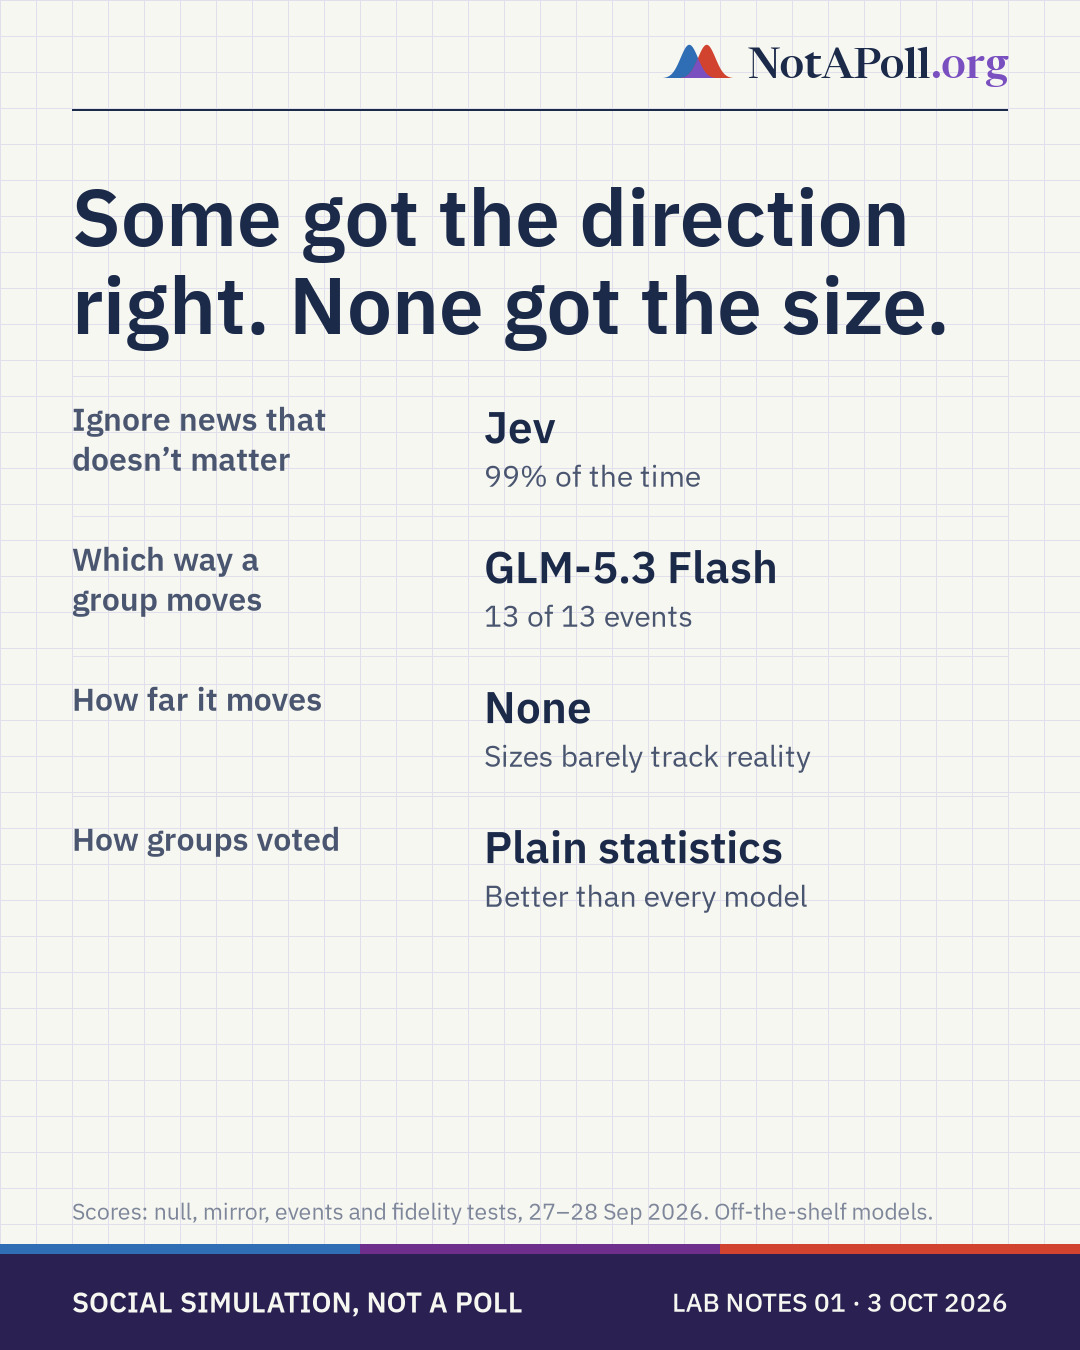
No model was good at everything. Each was good at one thing, or at nothing.
Jev, a small decision model, was the best at ignoring news that doesn't matter: it said "no change" 99% of the time. GLM-5.3 Flash was the best at reading which way a group moves: it got the direction right on 13 of 13 real events that shifted opinion.
None of them got the size of a reaction right. GLM's sizes barely tracked reality, with a correlation of 0.26 between what it predicted and what was measured.
And on the most basic question, how groups voted in 2024, plain statistics beat every model we tried.
In detail
On that last test we measured the gap between each model's answers and the real vote across demographic groups. A simple statistical model built on the same survey answers was about twice as close as the best language model. An untuned Kev, the model we later trained ourselves, reacted to about 1 irrelevant story in 4, which is why it got no job in this round.
The most useful finding was a shared one. The models didn't just make mistakes; they made the same mistakes.
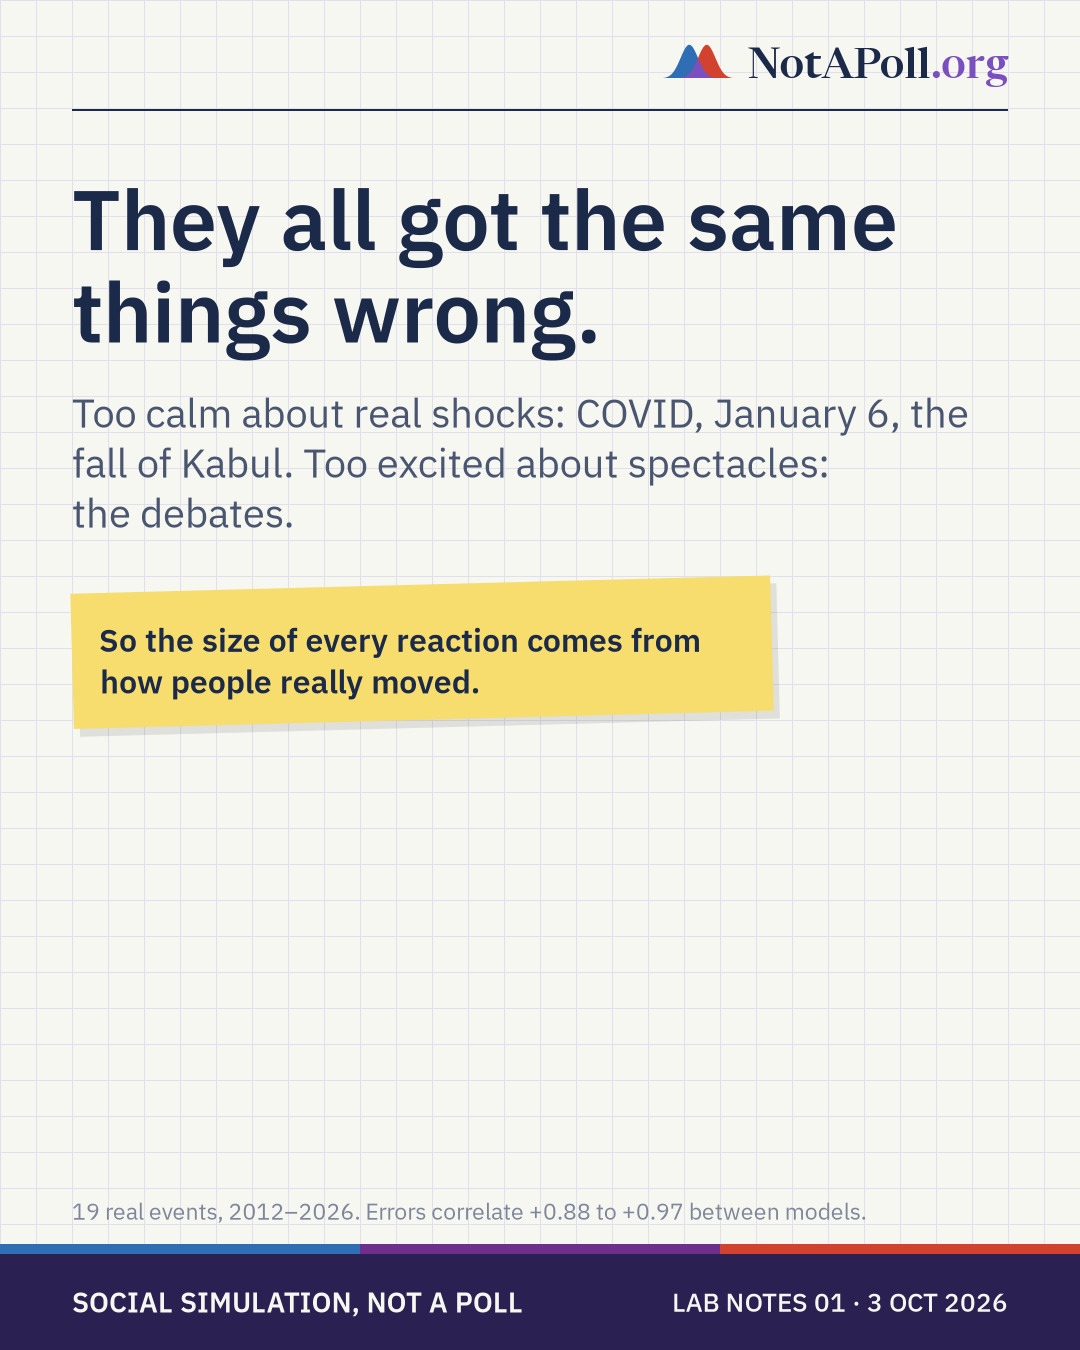
All of them were too calm about real shocks: the early weeks of COVID, January 6, the fall of Kabul. All of them were too excited about media spectacles, like the Access Hollywood tape and the presidential debates. A story that dominated television moved them more than a crisis that changed how people lived.
Because the errors line up, averaging several models doesn't cancel them out. So in our forecast, the size of every reaction comes from shifts that were actually measured in past events, never from a model's guess.
In detail
Across the 19 events, the models' errors correlate between +0.88 and +0.97 with each other. Averaging any two of them never beat GLM alone. We use the models for what they do well, the direction of a reaction, and real data for everything else.
So this is how the forecast is put together.
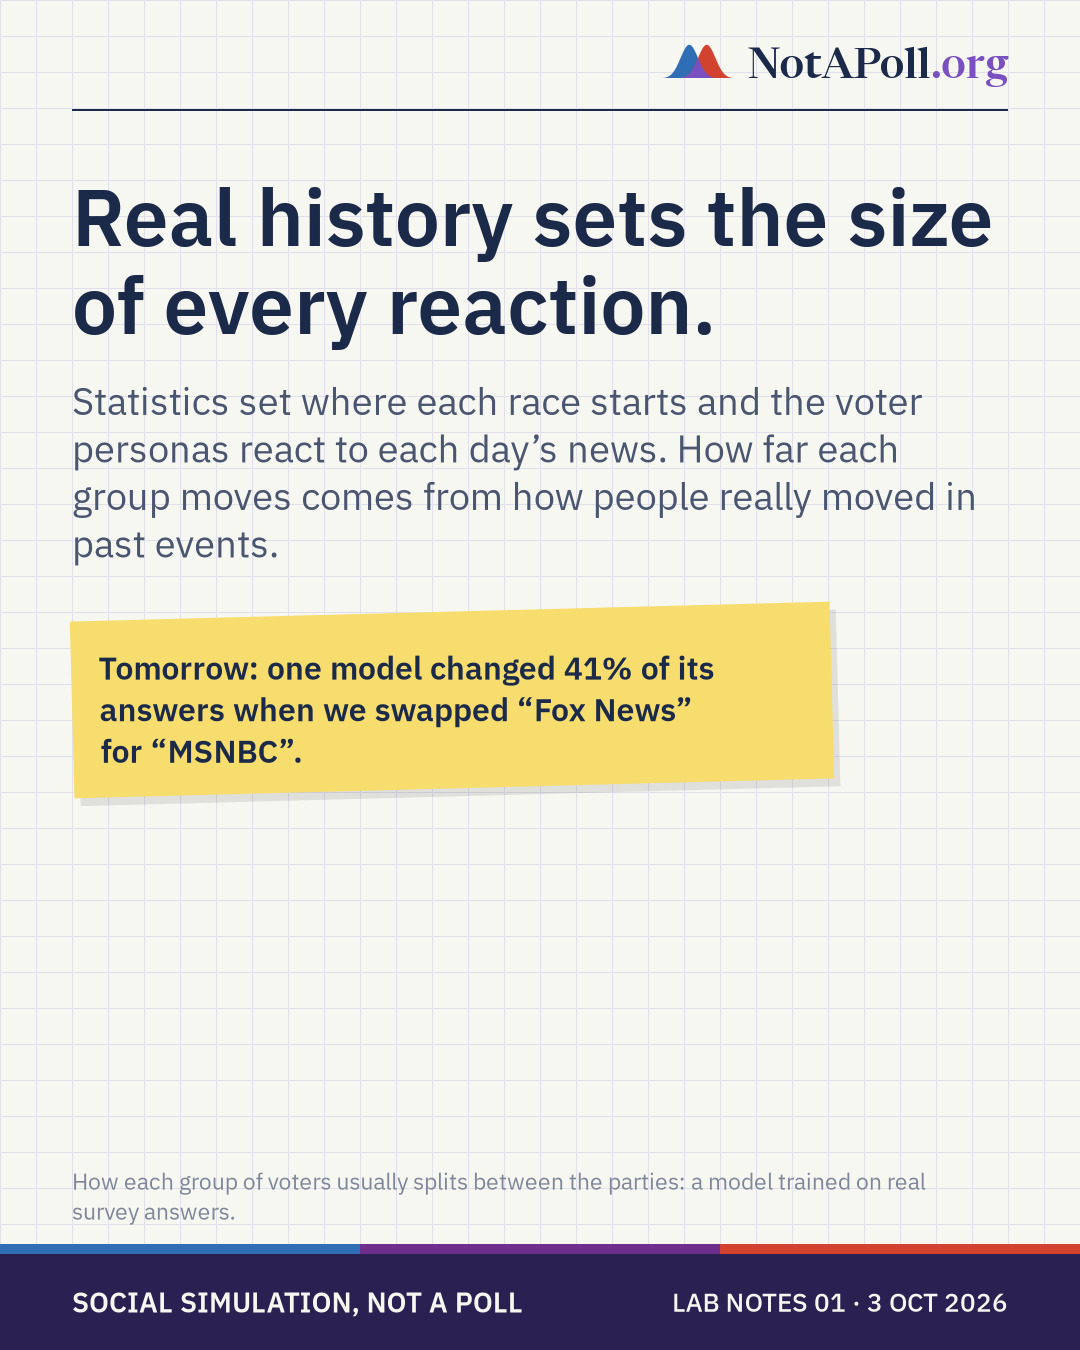
Statistics set each race's starting line: past results, the economy and the poll average. How each group of voters usually splits between the parties comes from Kev, a model we trained on real survey answers, which came out slightly closer to the real 2024 vote than the plain statistics on three states it had never seen.
Then, every day, the voter personas react to each day's news, and the model's job is narrow: which way does this story push each group? How far it pushes comes from measured history. Every week, the latest poll average decides how much of that shift to keep.
Tomorrow in Lab notes: what happened when we told the same story with a different newspaper's name on it.